Texas taxpayers are currently burdened with the second-highest local debt in the nation, on a per capita basis, when compared to the nation’s ten largest states. While the largest public borrowers in Texas are government school districts, nearly one-third of the $330 billion burden has been issued by cities.
Debt financing, while a necessary tool in certain circumstances, is dangerous when used frivolously. Excessive debt leads to higher property taxes, diverting existing tax revenue to debt service payments, and away from public services. From a political perspective, debt allows officials to flaunt a project’s “benefits” in the short-term while defraying the cost over a longer period of time, ultimately undermining public accountability.
As a result, taxpayers often perceive debt-financed projects as “free.” This dynamic is exacerbated by a lack of ballot transparency, as state law does not require all local governments to disclose a debt proposition’s total cost or its impact on future tax rates to voters. Reform attempts to increase transparency have largely failed to become a priority in a Republican-dominated legislature.
During the 84th session, limits on Capital Appreciation Bonds (C.A.B.s) and Certificates of Obligation passed, as did super-majority requirements for localities seeking to raise tax rates, in addition to efforts to eliminate “rolling polling.” While all are important victories, more structural reforms are needed.
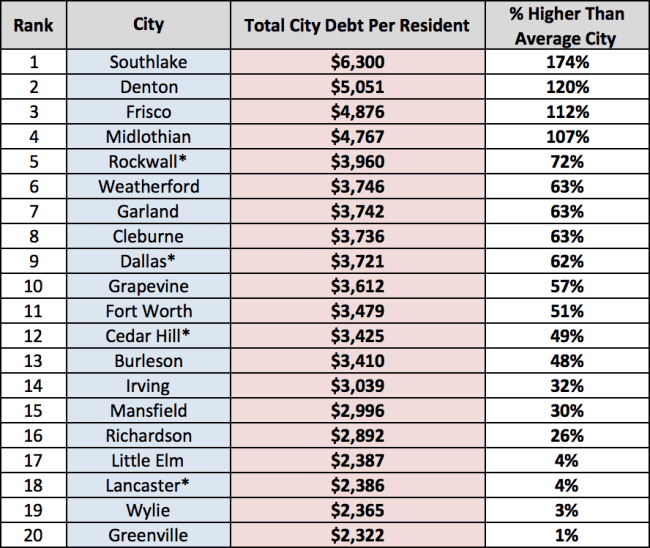
Below are the Top 20 cities with the highest total debt, on a per resident basis, among North Texas’ fifty most populous cities. These figures do not include debt issued by other local governments such as schools, counties, hospital, community college or other districts.

Cities primarily issue two forms of debt—tax and revenue supported bonds. Tax supported bonds are usually issued with voter approval through ballot referendums and are repaid with property tax revenue. Other types of tax-supported debt, such as Certificates of Obligation, are not voter approved, but are also repaid with taxes.
Revenue supported bonds are often issued to build stadiums, convention centers or utility infrastructure. They’re primarily repaid with user fees from customers, either directly from taxpayers, or from ancillary revenue generated from facility operation.
The above figures used in the Local Government Snapshot analysis combine all forms of debt issued or “total debt,” including tax and revenue supported debt, Certificates of Obligation and all other types of debt instruments.
Note: Each city’s 2014 Comprehensive Annual Financial Report (CAFR) provided all information used in our benchmarking analysis, including population figures.
*Cities that did not have their 2014 CAFR published online were included in our analysis using data from their 2013 CAFR.


